

mysqld_exporter是Prometheus用于监控MySQL指标的一个导出器,支持对MySQL 5.5以上进行监控。用来抓取mysql的相关信息,下面是mysqld_exporter 安装的相关信息
环境: 192.168.31.40 MariaDB-5.5.68 mysqld_exporter_0.12.1
一、下载mysqld_exporter 并安装
官方网址:https://prometheus.io/download/
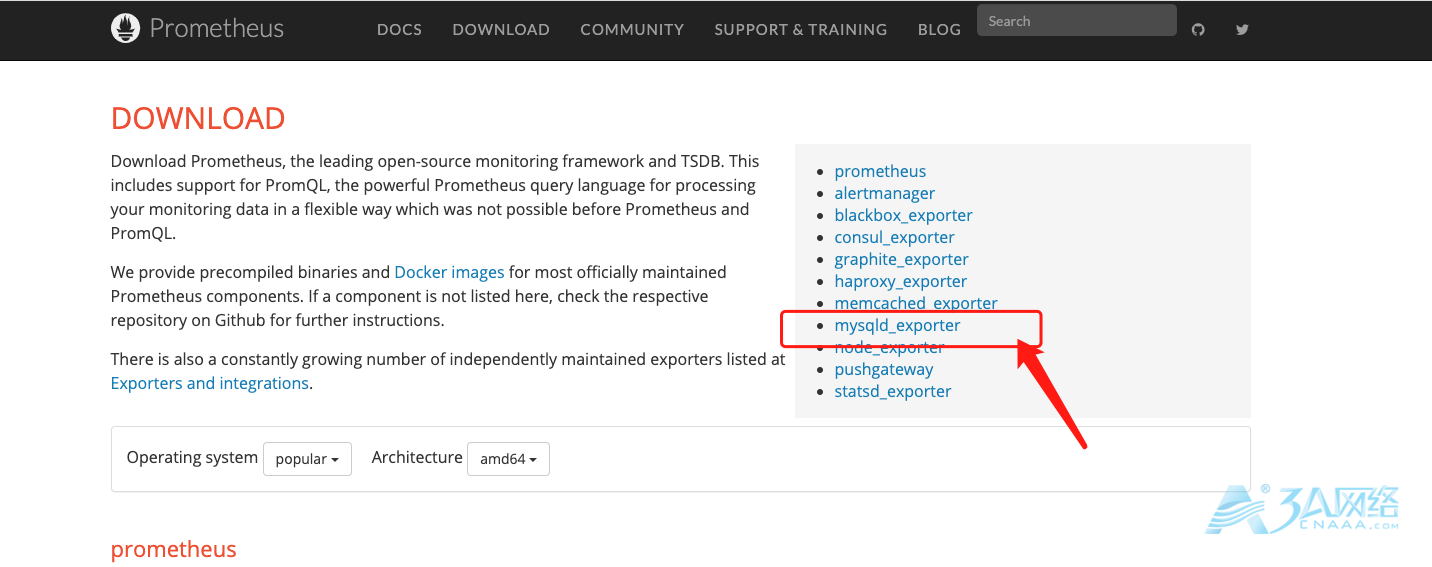

选择对应的版本下载
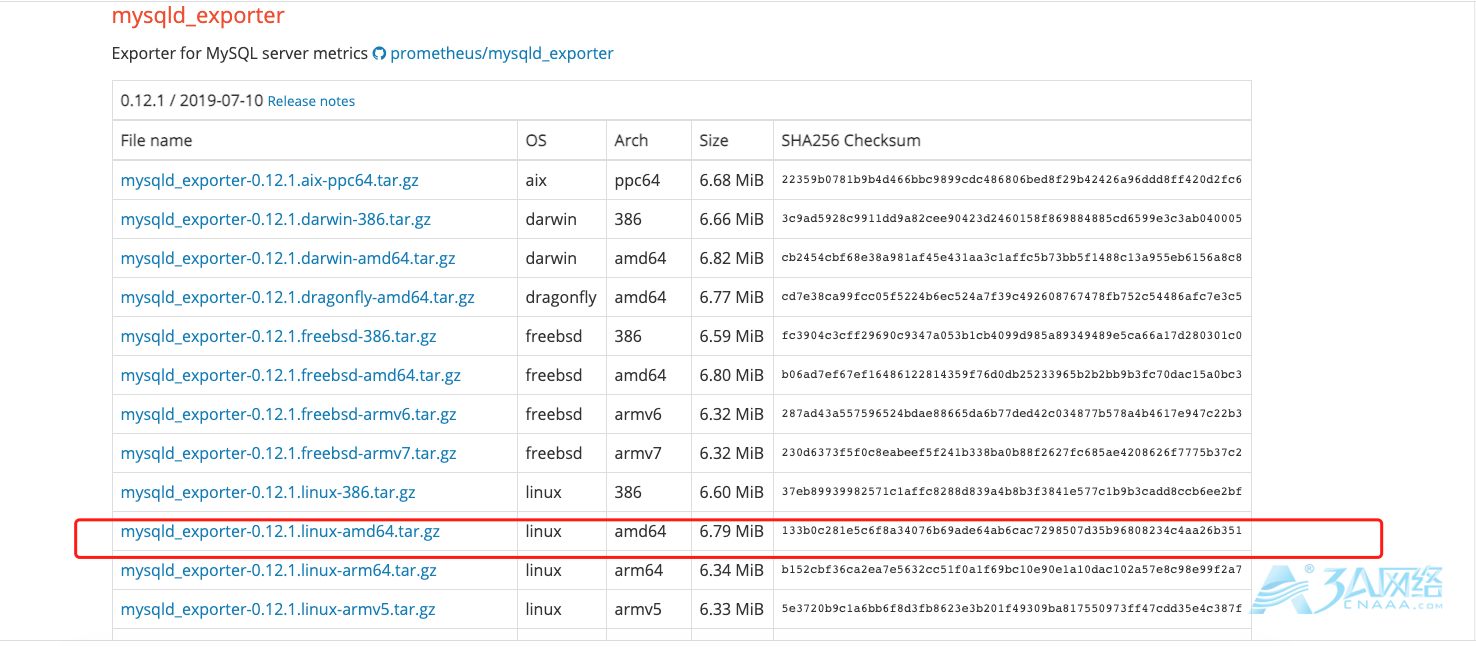
[root@node-1 ~]# wget https://github.com/prometheus/mysqld_exporter/releases/download/v0.12.1/mysqld_exporter-0.12.1.linux-amd64.tar.gz
#解压 ,移动到/usr/local 路径下 并从命名为 mysqld_exporter
[root@node-1 ~]# tar -xf mysqld_exporter-0.12.1.linux-amd64.tar.gz
[root@node-1 ~]# mv mysqld_exporter-0.12.1.linux-amd64 /usr/local/mysqld_exporter
二、登陆数据库,创建授权账户
[root@node-1 ~]# mysql -uroot -p
Enter password:
Welcome to the MariaDB monitor.  Commands end with ; or g.
Your MariaDB connection id is 278
Server version: 5.5.68-MariaDB MariaDB Server

Copyright (c) 2000, 2018, Oracle, MariaDB Corporation Ab and others.

Type 'help;' or 'h' for help. Type 'c' to clear the current input statement.

MariaDB [(none)]> grant PROCESS, REPLICATION CLIENT, SELECT on *.* to 'exporter'@'localhost' identified by 'fxkjnj';
MariaDB [(none)]> flush privileges;
#注意: 这里我只授权了本机登陆,因为 mysqld_exporter 也安装在数据库这台主机上
#退出验证,使用exporter 用户登陆数据库
 [root@node-1 ~]# mysql -uroot -p'fxkjnj'
Welcome to the MariaDB monitor.  Commands end with ; or g.
Your MariaDB connection id is 286
Server version: 5.5.68-MariaDB MariaDB Server

Copyright (c) 2000, 2018, Oracle, MariaDB Corporation Ab and others.

Type 'help;' or 'h' for help. Type 'c' to clear the current input statement.

MariaDB [(none)]> show grants;
+----------------------------------------------------------------------------------------------------------------------------------------+
| Grants for root@localhost                                                                                                              |
+----------------------------------------------------------------------------------------------------------------------------------------+
| GRANT ALL PRIVILEGES ON *.* TO 'root'@'localhost' IDENTIFIED BY PASSWORD '*A88C2B91E04CF458B1EFF3228824DEA7CE4ABA22' WITH GRANT OPTION |
| GRANT PROXY ON ''@'' TO 'root'@'localhost' WITH GRANT OPTION                                                                           |
+----------------------------------------------------------------------------------------------------------------------------------------+
2 rows in set (0.00 sec)

MariaDB [(none)]>
三、创建mysqld_exporter 的配置文件 my.cnf
[root@node-1 mysqld_exporter]# vim /usr/local/mysqld_exporter/my.cnf
[client]
host=192.168.31.40
port=3306
user=exporter
password=fxkjnj
四、创建mysql_exporter 启动文件,使用systemd 管理
[root@node-1 mysqld_exporter]# vim /etc/systemd/system/mysqld_exporter.service
[Unit]
Description=mysqld_exporter
Documentation=mysqld_exporter-doc
 [Service]
ExecStart=/usr/local/mysqld_exporter/mysqld_exporter --config.my-cnf=/usr/local/mysqld_exporter/my.cnf
 [Install]
WantedBy=multi-user.target
#初始化并启动mysqld_exporter
[root@node-1 mysqld_exporter]# systemctl daemon-reload
[root@node-1 mysqld_exporter]# systemctl start mysqld_exporter.service
#查看进程及端口
[root@node-1 ~]# ps -ef | grep mysqld_exporter | grep -v grep
root 60884 1 0 16:55 ? 00:00:02 /usr/local/mysqld_exporter/mysqld_exporter –config.my-cnf=/usr/local/mysqld_exporter/my.cnf
[root@node-1 ~]# netstat -ntlup | grep mysqld_export
tcp6 0 0 :::9104 :::* LISTEN 60884/mysqld_export
五、修改prometheus 配置文件 指定 mysqld_exporter 采集器地址
[root@prometheus ~]#vim /etc/prometheus/prometheus.yml
[root@prometheus ~]#vim /etc/prometheus/prometheus.yml
..............

scrape_configs:
  - job_name: 'prometheus'
    static_configs:
    - targets: ['192.168.31.250:9090']


  - job_name: 'mysql'
    static_configs:
    - targets: ['192.168.31.40:9104']

..............
#热加载prometheus
[root@prometheus ~]# ps -ef | grep prometheus | grep -v grep | awk ‘{print $2}’ | xargs kill -HUP
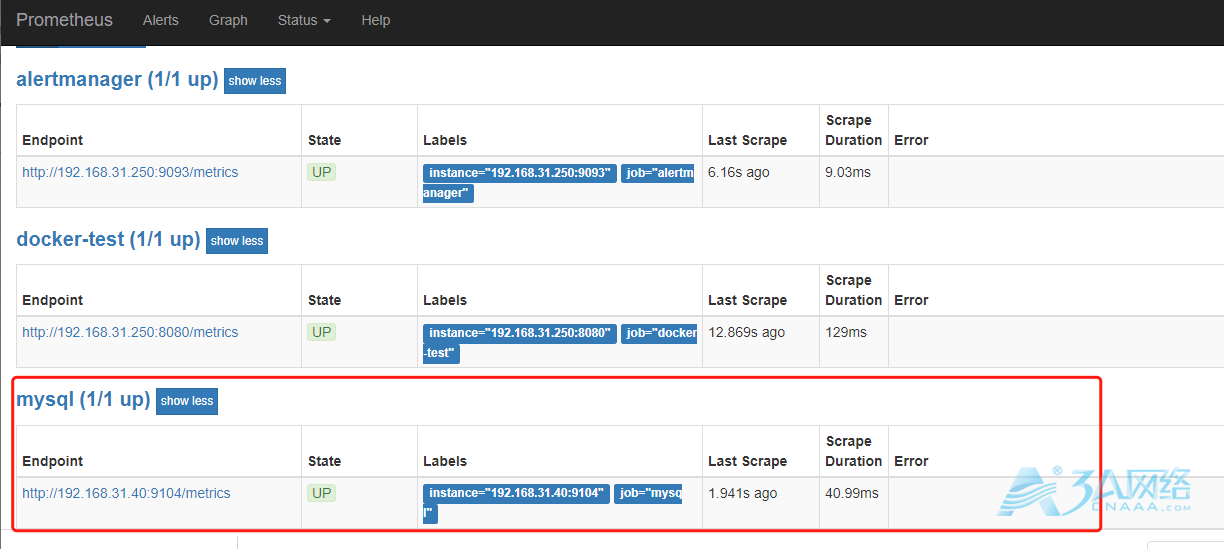
#登陆到prometheus 控制台,可以在status/targets 里看到 mysqld_exporter 采集器相关信息
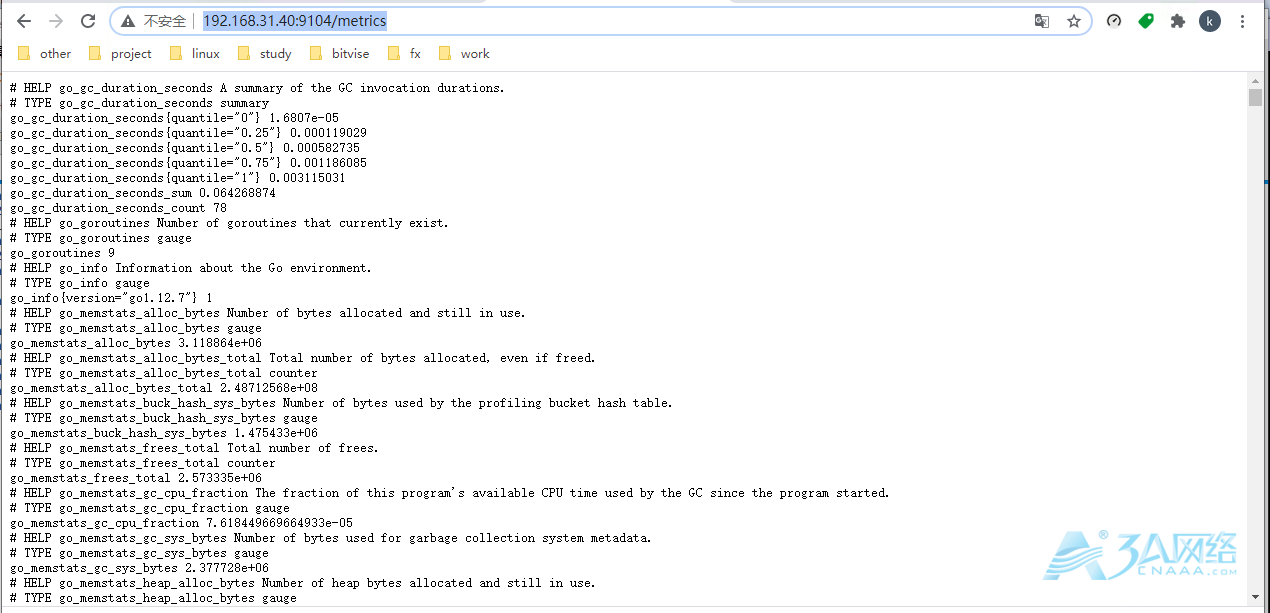
点击 http://192.168.31.40:9104/metrics 可以看到相关数据
六、使用grafana 展示 mysqld_exporter 采集器采集的数据
PS: grafana 添加 prometheus 数据源 过程 省略。。。。。。。。。。
为了最终的效果,我们使用 Grafana 官网小伙伴提供的dashboard 来展示数据
模板地址: https://grafana.com/grafana/dashboards/7362 ID: 7362
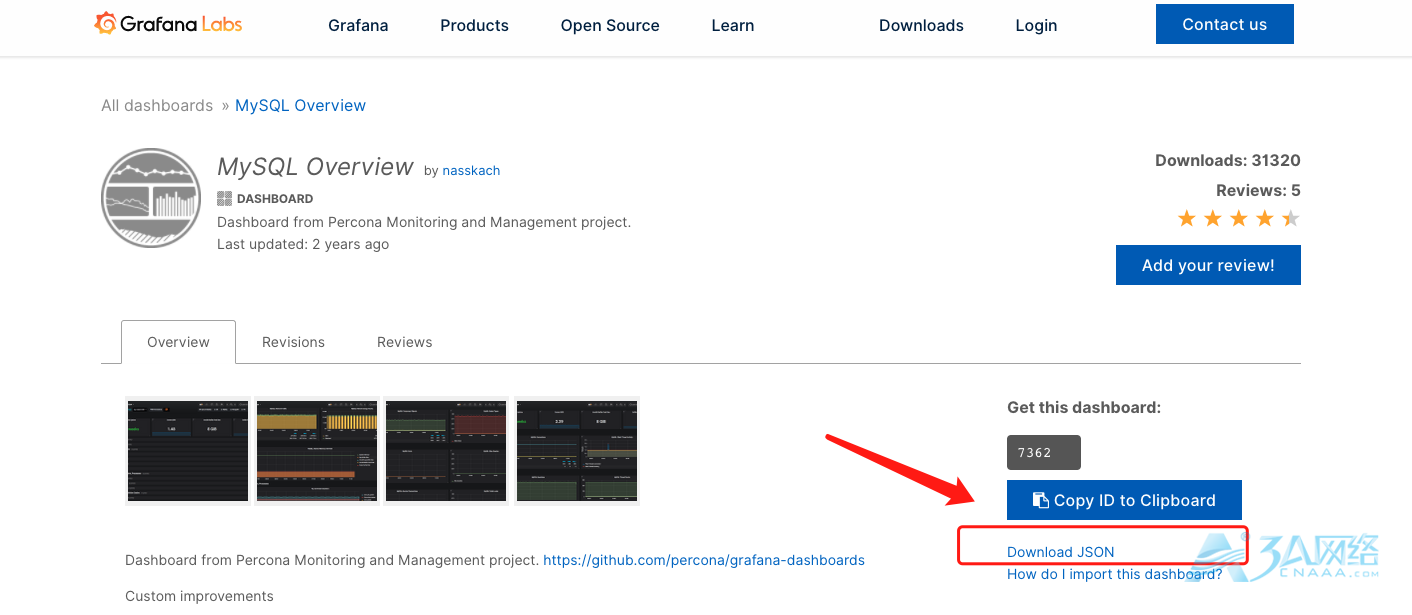
点击 Download JSON , 下载完后 登陆Grafana ,默认地址 http://IP:3000
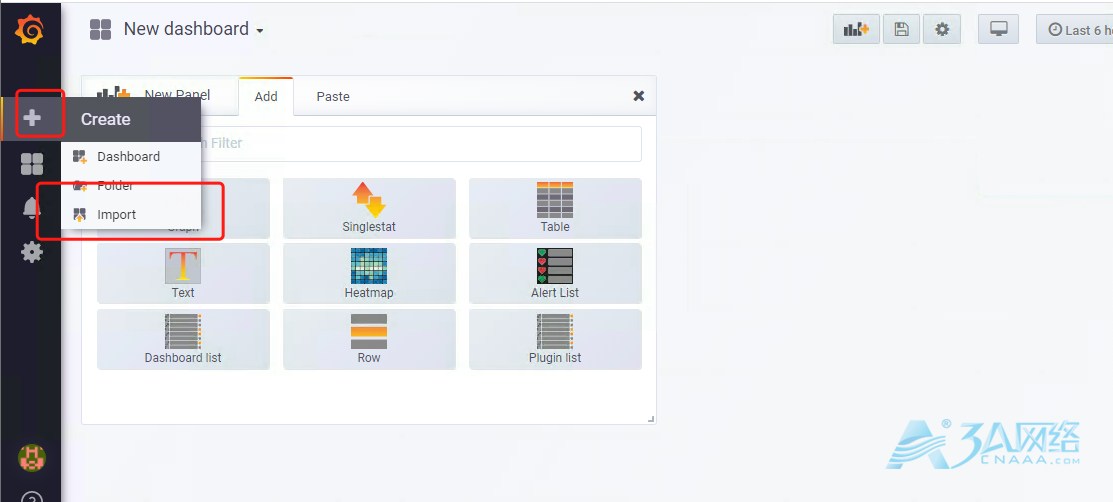
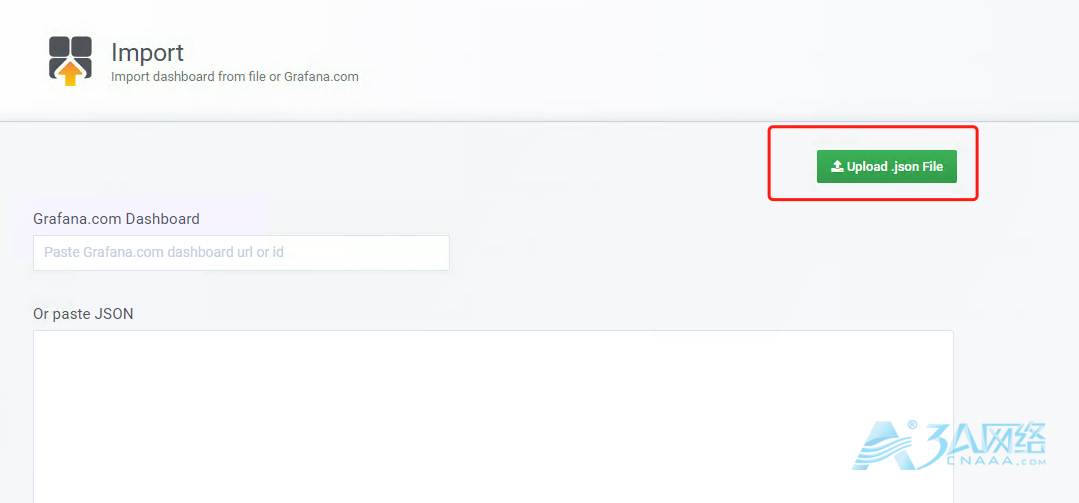
找到左侧 + 号,import 导入刚刚下载的json 文件
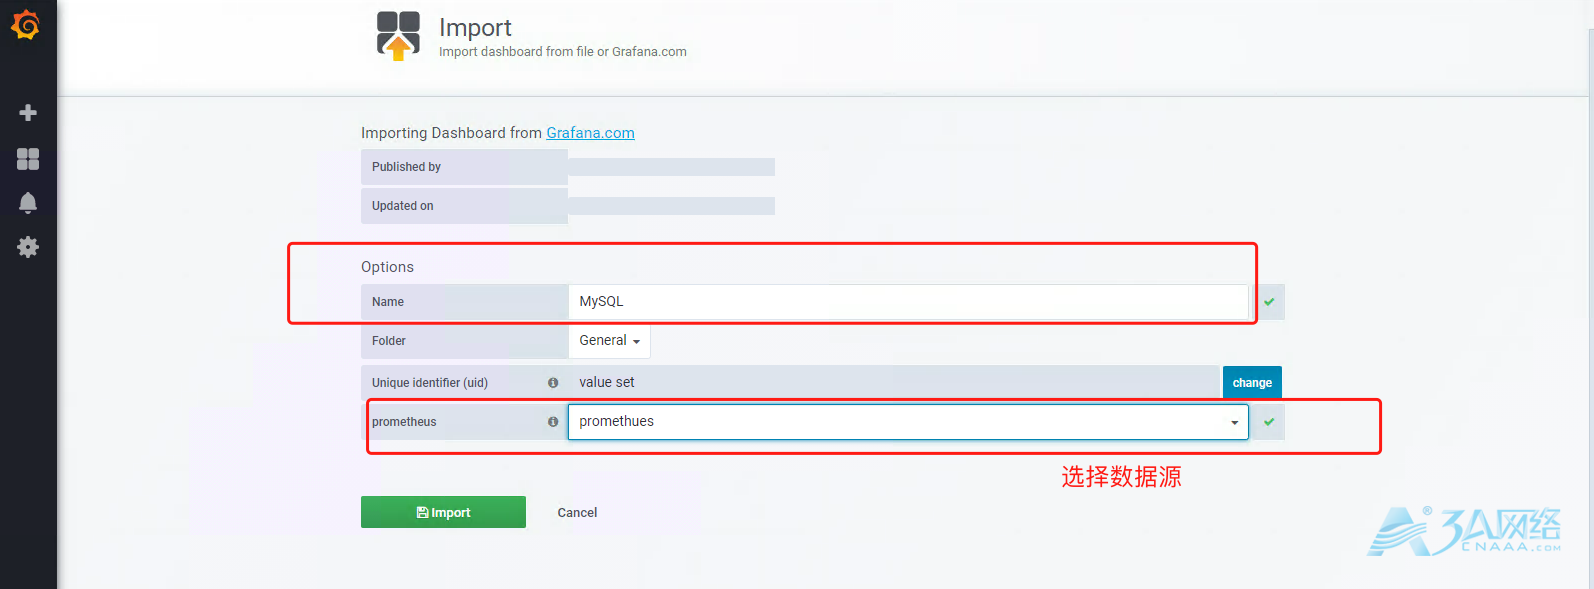
选择好数据源
稍等片刻,就可以看到 最终的效果
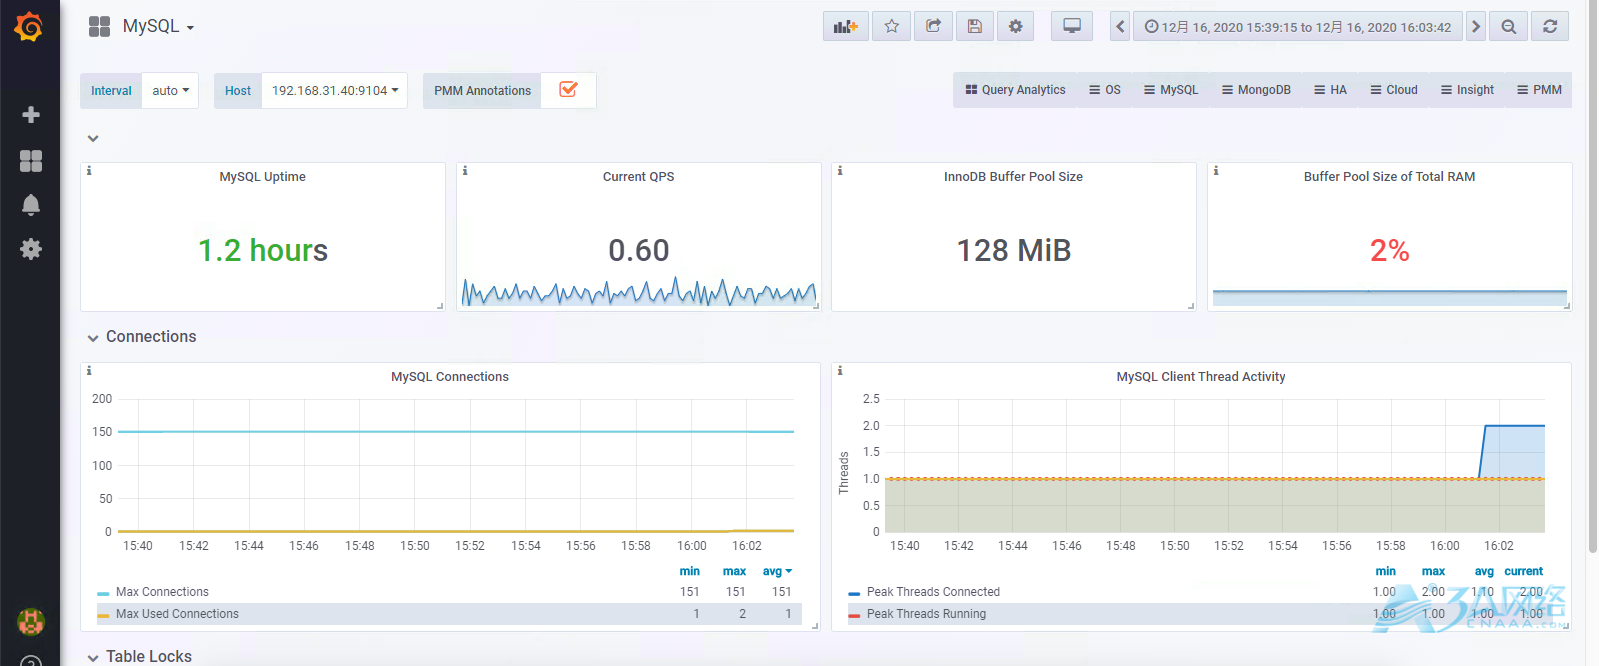
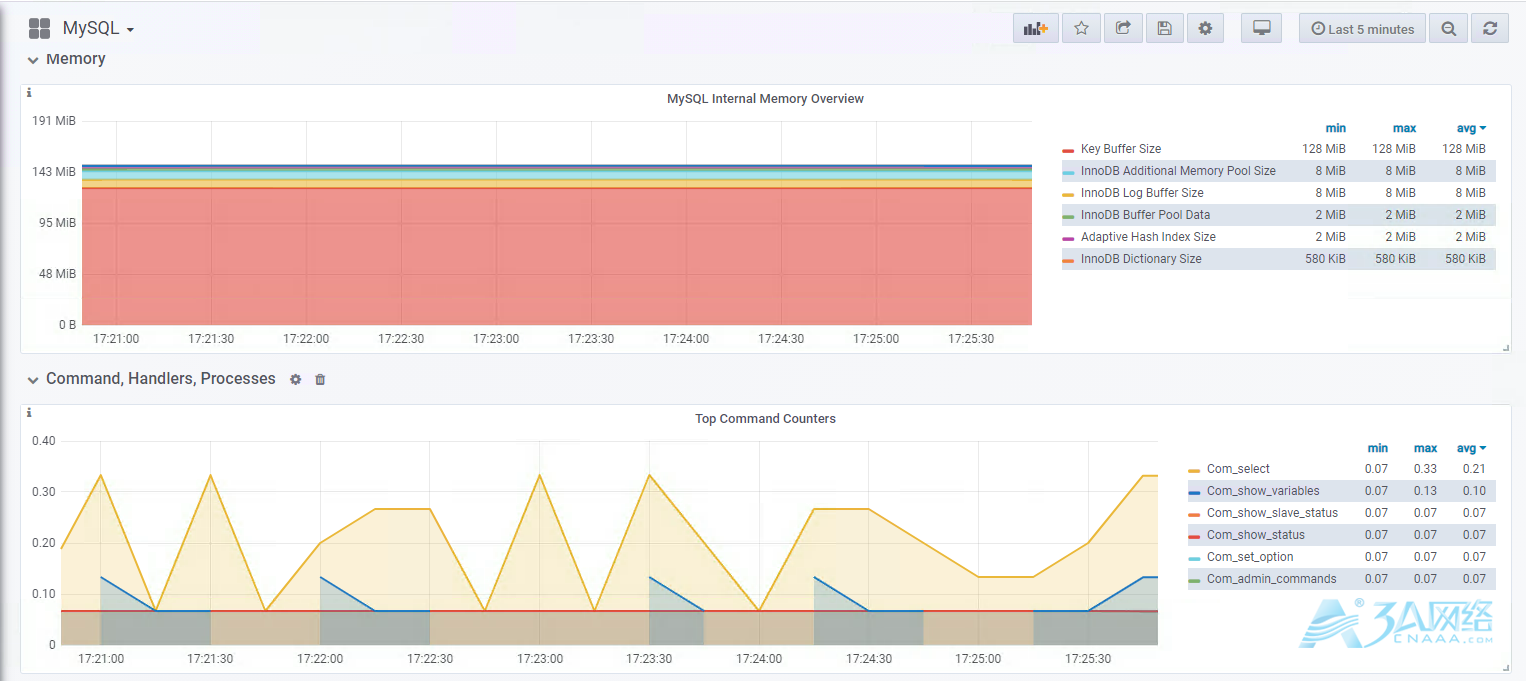
本篇只涉及到 使用mysqld_exporter 收集mysql 数据并展示 ,并没有写到 触发器的配置告警,这个等后面再更新
文章来源:https://www.cnaaa.net,转载请注明出处:https://www.cnaaa.net/archives/8203